Power modeling
Power modeling is nothing more than a prediction and interpretation of the power generated for a period x of time, where we take into account the best records of each point in the curve.
With this modeling allows us to have different records in the power curve, From the first second to the longest extension of training or competition that the athlete has done for a certain period of time, The more records for each temporary segment that is better and more precision in the modeling generated.
This modeling will allow us to interpret if the athlete is improving any specific capacity, If it is true that with the model we will many times will save some tests (for example the FTP test) since training/competitions or records close to the capacity we want to endorse will show us an update of the metrics and with which, A new test will not be necessary to get the concrete assessment of x time.
For work with the modeling of the power curve We use WKO5 software in our data analysis, where applies mathematical calculations of an algorithm, with high reliability in the generation of this modeling in relation to others. Through this software we also obtain a series of new metrics that we already collect in another Blog entrance A long time ago.
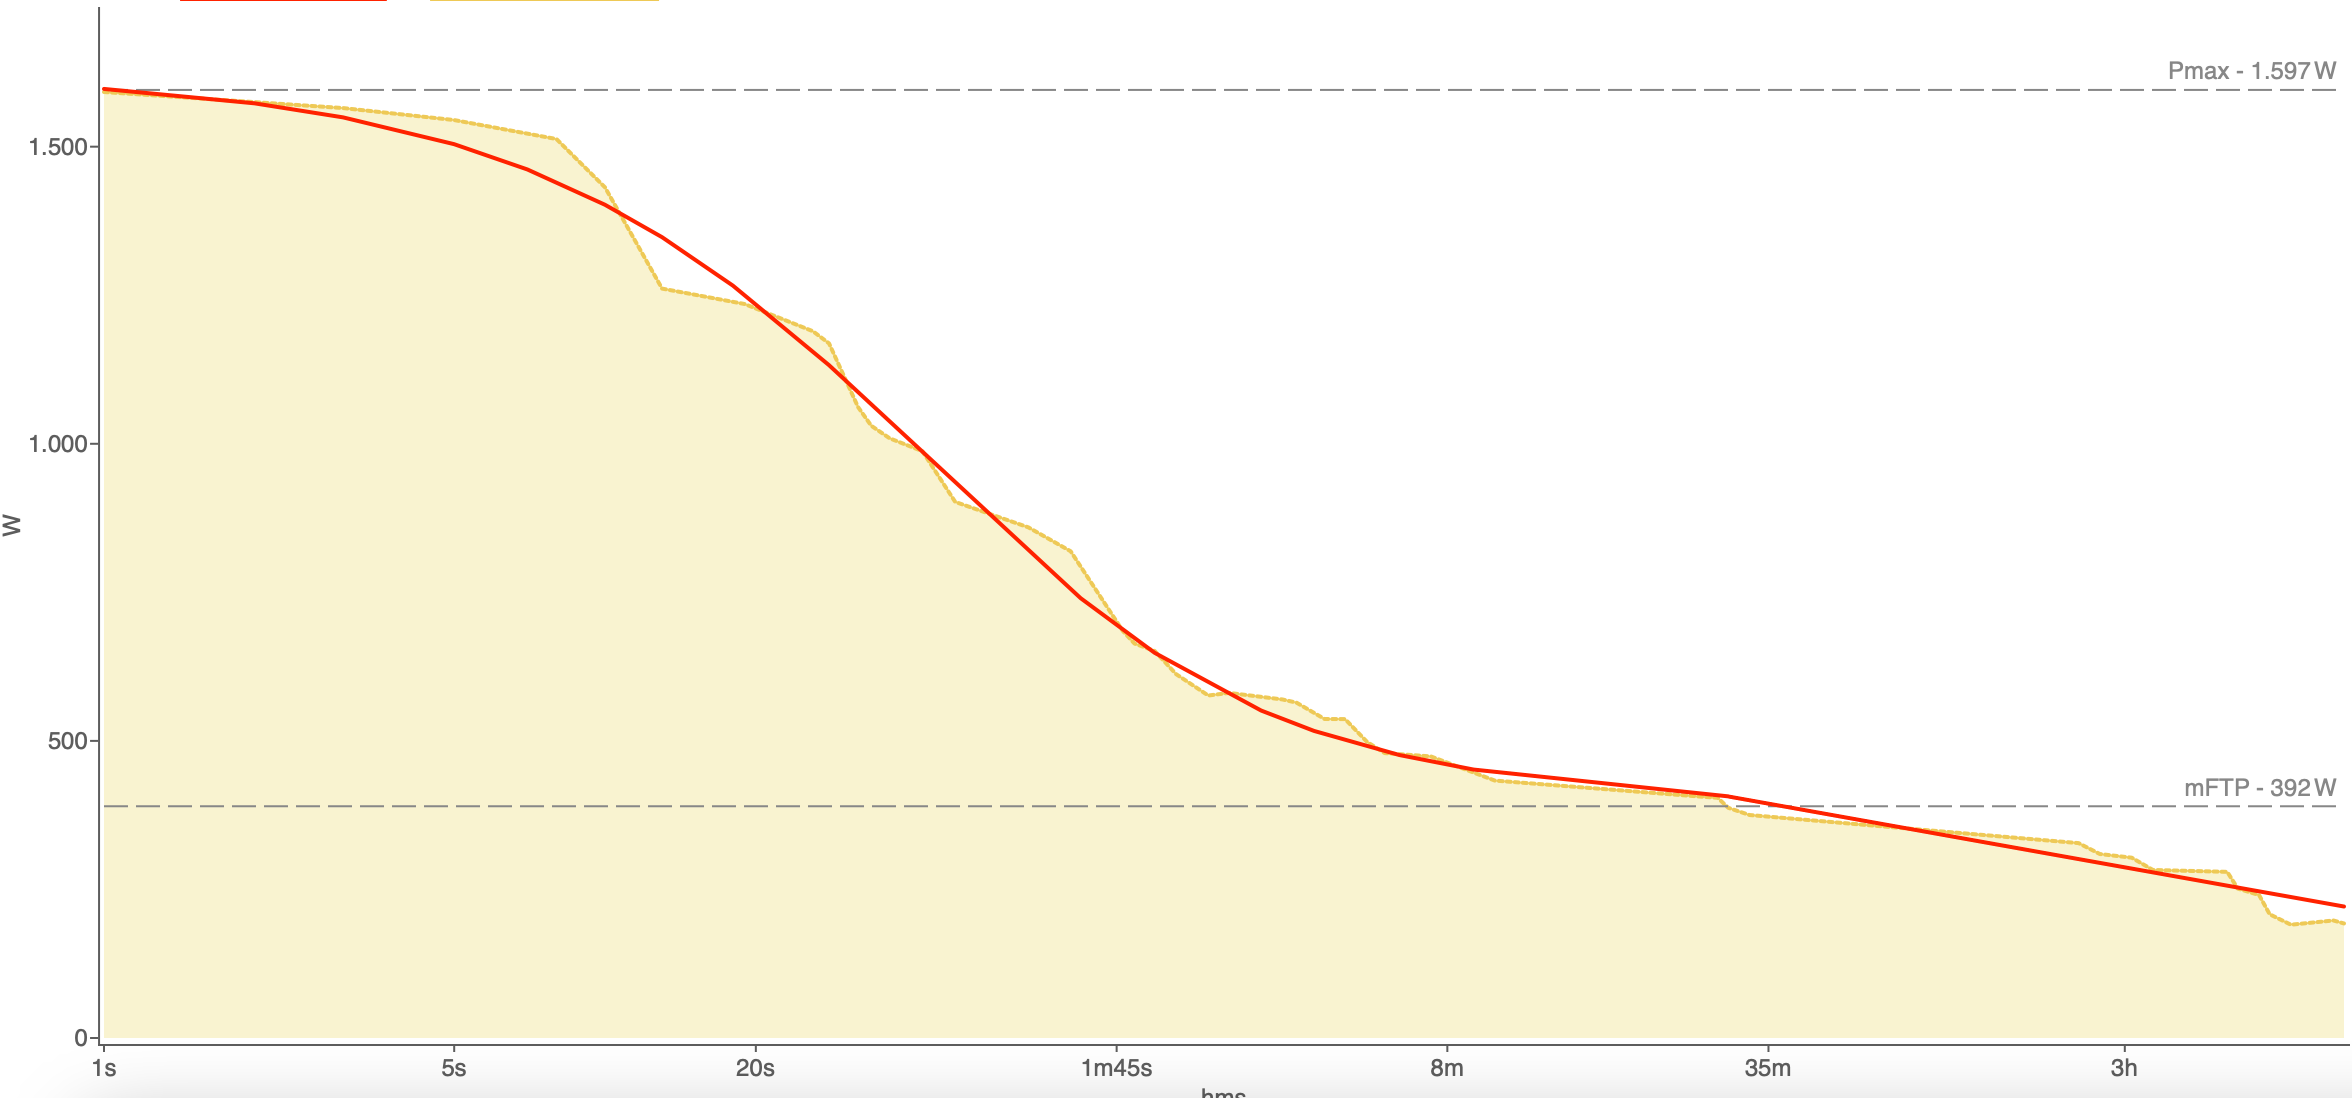
In the image you can see the red line that is the modeling and yellow the best records for a certain period of time (last 90 days). This graph shows the high reliability of the modeling in relation to the data that the athlete has registered during this period of the season.
To greater data provided, greater will be the reliability of this graph and performance prediction.
With the modeling we can find out which athlete's profile we have in front and What metabolic pathways predominate in their competitive activity And where are your strengths / weak points to find an improvement in your performance.
Before all this information that we previously commented on the power curve and its modeling Ilevels appear from it that will be the areas based on the individual's individual physiology, not following the % of the FTP as established in a general way to take & Hunter.
Basically with the Ilevels there is great individualization above the FTP, Where is there is practically the same but not already above, where each individual responds different in the intensities of the "red" area, where a fast athlete can endure more time for example in his area of anaerobic capacity than an athlete with a greater presence of slow fibers, where this will surely endure more time and to greater power the aerobic areas in relation to the rapid.
With the Ilevels the individualization For training of training it is total or more accurately than other methods so far detailed in power training, thus taking out the juice to our power data we take day after day.
The cadence of your pedaling
The pedaling cadence is the same as the revolutions per minute in any motorized vehicle
Muscle fibers: Typology and identification of them
We have sometimes talked about genetic abilities of athletes, more specifically the cyclis
Maximum lactate at steady state
Recomming the physiological milestones of our metabolism, we will write to you on the max


